Visualizing GeoJSON Data on the Web using JavaScript
Bringing Data to Life
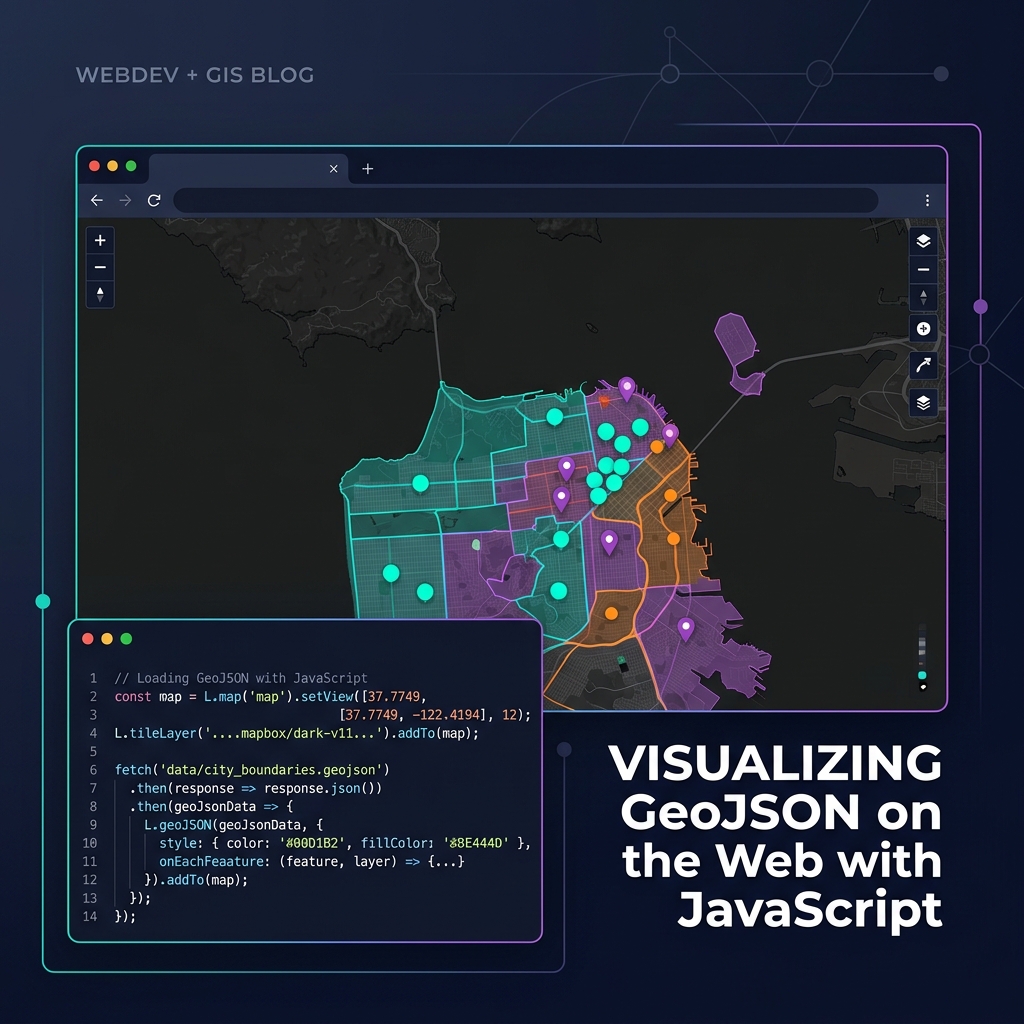
Once you have your geographic data in GeoJSON format, rendering it beautifully in the browser is straightforward thanks to modern mapping libraries.
Choosing a Library
- Leaflet.js: Lightweight, easy to learn, perfect for simple maps and smaller GeoJSON datasets (under 10,000 features). Uses DOM elements (SVG/Canvas) to render.
- MapLibre GL JS / Mapbox GL JS: WebGL-accelerated. Incredibly fast, capable of rendering millions of points smoothly. Requires data to be styled using layers and sources rather than iterating over arrays.
A Simple MapLibre Implementation
Here is how you add a GeoJSON source and a polygon layer using MapLibre:
const map = new maplibregl.Map({
    container: 'map', // HTML div id
    style: 'https://demotiles.maplibre.org/style.json',
    center: [-74.006, 40.712], // Longitude, Latitude
    zoom: 10
});

map.on('load', () => {
    // 1. Add the GeoJSON as a data source
    map.addSource('my-data', {
        'type': 'geojson',
        'data': 'https://example.com/data.json'
    });

    // 2. Add a visual layer connected to the source
    map.addLayer({
        'id': 'polygons-fill',
        'type': 'fill',
        'source': 'my-data',
        'paint': {
            'fill-color': '#088',
            'fill-opacity': 0.6
        }
    });
});
For large datasets, always consider converting your GeoJSON into Vector Tiles (e.g., using Tippecanoe) before serving them to the client!
GeoSpatial